Peter Whyte – SQL Server DBA & Engineer
🚀 All new SQL Server DBA content now lives at sqldba.blog →
Visit the dedicated site for scripts, HA/DR engineering, monitoring, and performance tuning.
I’m a Senior SQL Server DBA and database engineer based in Scotland, specialising in Microsoft SQL Server environments across live enterprise systems.
With over a decade of hands-on experience, I design, support, and maintain high-availability database platforms – working extensively with Always On Availability Groups, failover clustering, monitoring, performance optimisation, and operational resilience.
My focus is practical engineering: building resilient systems, maintaining stability under load, troubleshooting complex issues, and delivering solutions that are reliable, maintainable, and fit for long-term operation.

Search This Blog
Recent Blog Posts
-
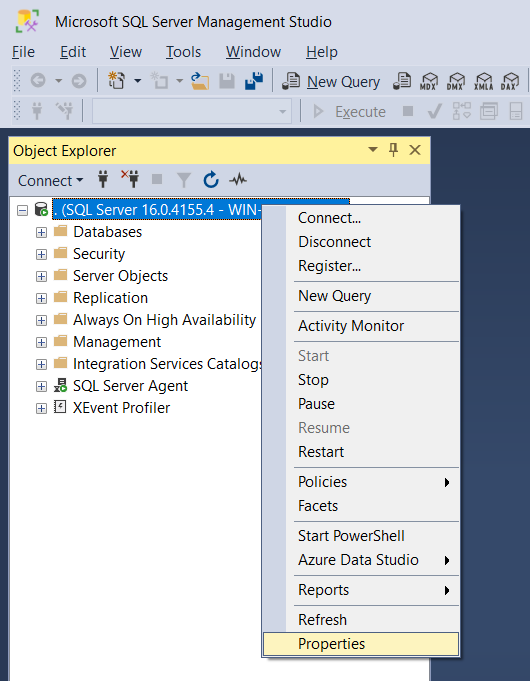
SSMS 21 (Preview Release)
This week I installed SQL Server Management Studio SSMS v21 for the first time, which is currently in preview release. From the get-go, I noticed this is shaping up to be a major update to SSMS. The installation process now uses the Visual…
-
Sudo for Windows: A Quick Overview
With the release of Windows 11 version 24H2 in September 2024, Microsoft introduced Sudo for Windows, adding Linux-like functionality for managing system privileges. Having Sudo on Windows allows us to execute commands with administrative rights directly from a non-elevated console session, making it…
-
SQL Server: Get Current Date & Time
Retrieving the current date and time is a fundamental operation in SQL Server, essential for logging, data tracking, and reporting. Whether you need a simple timestamp for everyday use or require high-precision time tracking for financial transactions, SQL Server provides built-in functions that…
-
Log and Filter sp_who2 Results in SQL Server
When managing SQL Server performance, the built-in sp_who2 procedure is a commonly used tool for quickly checking active processes and their resource usage. However, it doesn’t always give you much flexibility when analyzing SQL sessions. In this post, I’m sharing a simple SQL…
-
PowerShell Tail: A Familiar Approach to Log File Monitoring
In the Linux world, the tail command is a go-to tool for monitoring logs in real-time. While Windows doesn’t have a direct equivalent, PowerShell’s Get-Content -Tail command provides similar functionality for log monitoring. To help bridge the gap for Linux users and improve…
-
How to Open PowerShell as Administrator
This post covers most various ways for how to open PowerShell as Administrator on Windows, ensuring you have the necessary permissions for advanced operations. Running PowerShell commands with elevated privileges is often necessary when configuring system settings, installing software, or troubleshooting issues. I…
More about this blog
I began my blogging journey in 2017, driven by a desire to create a dedicated space for technical notes, share my expertise, and help fellow SQL Server DBAs in the field. It took years of trial and error to learn how to build and manage a website using WordPress and to develop the skills needed to write and format effective, insightful blog posts.
It’s been a long journey, forever learning and forever trying to achieve consistency with publishing new content regularly. With each year, life and career bring unforeseen challenges that may disrupt progress, however the ambition has always been there. My primary goal is to publish new content online consistently, while continuing to learn and improve every step of the way, in both my Database Admin skills and maintaining good websites.
While the site had periods of inactivity, as of late November 2024, I’ve found renewed focus and sustained momentum. I’m excited to keep this consistency going and look forward to exploring new ideas, experiments, and growth along the way.
I hope you enjoy reading my work and that it helps expand your knowledge of SQL Server, and beyond! There’s plenty more here than just the SQL database content.
DBA Notes & Links
Useful links to official documentation pages, or some internal pages. This is my own list of links that I find useful for the day-to-day duties as a MSSQL Database Administrator. There’s not a working day that goes by without looking at (mostly Microsoft) documentation, that’s always the first place we should be looking for our technical information.
SQL Server Downloads
– Download SQL Server
– Download SQL Server Management Studio (SSMS)
– Visual Studio Code
Cloud Portals
Frequently Asked Questions
(…FAQ’s I made up)
What is a DBA?
A DBA stands for Database Administrator. This is a role in the field of information technology (IT) responsible for managing and maintaining databases. The DBA’s tasks ensure that databases are efficiently running, secure, and available to users. The main focus of this blog is Microsoft SQL Server, one of many Relational Database Management Systems (RDMS) available on the market.
What is the purpose of this blog?
To provide valuable information for DBAs, software developers, sysadmins, and other IT professionals, offering insights on best practices, troubleshooting particular issues, and information on new tools or software updates. You may see display Ads, and there are no Affiliate links on this site.
What skills are required to be a DBA?
A DBA should have a strong understanding of database management systems (DBMS), SQL, and database design. Key skills include performance tuning, data backup and recovery, security management, and troubleshooting. Familiarity with Operating Systems, Cloud technologies, Automation, and Scripting are focus areas.
How do I become a DBA?
To become a DBA, start by gaining a strong foundation in computer science and database management. You should learn SQL, database design, and how to work with popular DBMS like MySQL, SQL Server, or Oracle. Gaining experience through internships or entry-level IT positions, and earning certifications (such as Microsoft Certified: Azure Database Administrator) can also boost your qualifications. Hands-on practice with database administration tasks like performance tuning, backups, and security will further develop your skills.
More About the Author
The Author, Peter Whyte. That’s me.
I’m a SQL Server Database Administrator, working remotely from Edinburgh, Scotland. I’ve always been passionate about the database world, and have been dedicated in growing my technical skills from early career until reaching goals, and beyond.
When I’m not immersed in databases or system administration, I’m focused on being a present dad to my daughter. And when time allows, I like to go out hiking &/or camping to recharge.
I hope you enjoy my content offerings, whatever you might browse through. I enjoy knowing I’m helping grow the Internet, via blogging, and by being very dedicated working at an Internet company.
Got questions or feedback? Feel free to reach out via my personal blog site as linked.