To time a command in PowerShell, wrap it in Measure-Command:
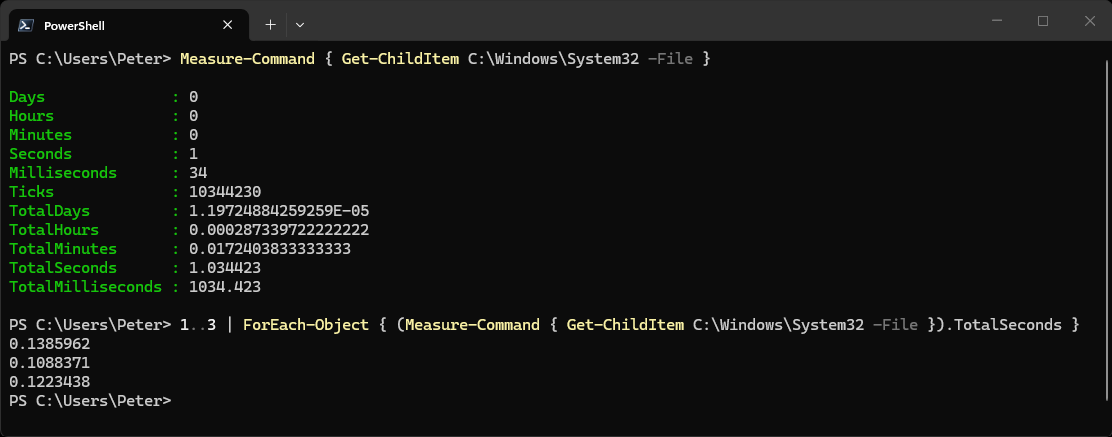
Measure-Command { Get-ChildItem C:\Windows\System32 -File }It runs everything inside the braces and returns how long that took, as a TimeSpan. In the screenshot below the listing took just over a second the first time, then about a tenth of a second on each repeat.
What it does not return is the output of the command itself. The file list is thrown away, which is the first thing that catches people out.
Just the Number
Most of the time you want one figure, not eleven lines. Pick the property:
(Measure-Command { Get-ChildItem C:\Windows\System32 -File }).TotalSeconds
(Measure-Command { Get-ChildItem C:\Windows\System32 -File }).TotalMilliseconds
Use the properties that start with Total. The others are the parts of the time, not the whole of it, and that is covered in the gotcha below.
Run It More Than Once
The first run is often the slow one, because the files or the module are not cached yet. When I timed the System32 listing above, the first run took just over a second and the next ones about a tenth of a second. Time it a few times before you believe a number:
1..5 | ForEach-Object {
    (Measure-Command { Get-Process | Out-Null }).TotalMilliseconds
} |
    Measure-Object -Average -Minimum -Maximum
That gives a count, an average, the fastest and the slowest of five runs. If you are comparing two ways of doing the same thing, compare averages, not a single run each.
Where Did the Output Go?
Measure-Command discards anything the command writes to the pipeline. Write-Host still shows, because it goes straight to the console. To see normal output while timing, pipe it to Out-Host inside the braces:
Measure-Command { Get-Service | Where-Object Status -eq 'Running' | Out-Host }Bear in mind that drawing the output on screen is part of the time you are measuring. For a fair timing of the work itself, leave it out or pipe it to Out-Null.
Variables Set Inside It Stay Set
The script block runs in your current session, not in a separate one:
Measure-Command { $total = 42 } | Out-Null
$total
That prints 42. Usually harmless, but if you time a block that changes $ErrorActionPreference or changes directory, the change is still there afterwards.
Timing Part of a Script
Measure-Command wants the whole block in braces. To time a stretch of a longer script, a stopwatch is tidier:
$sw = [System.Diagnostics.Stopwatch]::StartNew()
# ... the slow part ...
$sw.Stop()
$sw.Elapsed.TotalSeconds
That is handy in a scheduled script that writes its own run time to a log. How to Automate PowerShell Scripts with Task Scheduler covers setting one up.
Windows PowerShell 5.1 and PowerShell 7
I ran every example here in both, and Measure-Command behaved the same: same TimeSpan, output discarded in both, variables kept in both, and piped input runs the block once per item in both. The only differences I saw were cosmetic. PowerShell 7 colours the property names, and it lists an extra common parameter, -ProgressAction.
The Common Gotcha: Seconds Is Not the Whole Time
Seconds is the seconds part of the time, from 0 to 59. A run of 75.5 seconds shows Minutes : 1, Seconds : 15 and TotalSeconds : 75.5. Read Seconds on its own and a slow command looks fast. The same goes for Milliseconds against TotalMilliseconds.
If a timing makes no sense, paste the command and the output into Claude Code and ask what you are actually measuring. That’s what it’s there for.
Related
If SQL Server is part of your day job, my current work lives over at sqldba.blog: production DBA scripts, an error library and the SSMS guide.
Leave a Reply